anything
AirNav RadarBox
Welcome, Guest. Please login or register.
Did you miss your activation email?

Login with username, password and session length


Author Topic: Do I Need A Filter?  (Read 13761 times)

0 Members and 1 Guest are viewing this topic.

abcd567

  • Hero Member
  • *****
  • Posts: 842
  • CYYZ - Toronto
Do I Need A Filter?
« on: October 29, 2017, 12:09:41 AM »
(1) INTRODUCTION
In addition to receiving ADS-B signals, the ADS-B antenna also receives Cell/Mobile/Pager signals in the range 800 MHz to 1200 MHz. The Cell/Mobile signals are generally much stronger than the ADS-B signal. When these strong signals reach the receiver, they overload its front end tuner. This overload severely affects performance and reduces maximum range and number of planes. Stronger the Cell/Mobile signal, lower is the max range & number of planes.

To overcome this situation, a hardware called “Filter” is used. As its name shows, it filters out unwanted signals and passes a narrow band of frequency around 1090 MHz (say 1075 MHz to 1150 MHz), blocking most Cell/Mobile/Pager signals from reaching the receiver.

In order to determine if a filter is needed or not, it is necessary to scan frequencies in the range 800 MHz to 1200 MHz. If the scan shows very few and weak interfering signals, adding a filter will not give any appreciable improvement. On the other hand if the scan shows a lot of strong interfering frequencies, adding a filter will give substantial improvement in ADS-B 1090 MHz reception.

(2) How To Find Out RF Signals Affecting ADS-B Reception in Your Area
Software developers have developed softwares which use a very low cost ($10) hardware (DVB-T) to perform this scan. There are following 3 ways it can be done. Please click the options below to see the details.

Please note that you have to connect an antenna to DVB-T. It can be either the whip antenna supplied with the DVB-T, or preferably your regular ADS-B antenna to get more realistic results. Since DVB-T's antenna socket requires a MCX-male fitted to antenna cable, you will need a pigtail with MCX-male connector at one end, and at other end a connector which matches the connector on your antenna cable.


OPTION-1:
DVB-T is plugged into Raspberry Pi (or is plugged into a Desktop/Laptop running Linux Debian/Ubuntu)

OPTION-2:
DVB-T is plugged into a Windows Computer - Using GUI rtlpan,exe.

OPTION-3:
DVB-T is plugged into a Windows Computer - Using Command Line.

OPTION-4:
DVB-T is plugged into a Windows Computer - Using software "Spektrum".


.
« Last Edit: December 27, 2020, 10:32:05 AM by abcd567 »

abcd567

  • Hero Member
  • *****
  • Posts: 842
  • CYYZ - Toronto
Re: Do I Need A Filter?
« Reply #1 on: November 06, 2017, 10:36:35 PM »
OPTION-1:
DVB-T plugged into Raspberry Pi.

This method uses software tool rtl_power which is part of software package rtl-sdr.

Credits:
Kyle Keen (keenerd): For rtl_power and heatmap.py
Oliver Jowett (obj): For guide how to use rtl_power and heatmap.py

STEP-1 of 6:
Install required packages (rtl-sdr and python-imaging), and get the python script (heatmap.py) to create image scan.png from scanned data stored in file scan.csv
Code: [Select]
sudo apt-get install rtl-sdr
sudo apt-get install python-imaging
sudo wget https://raw.githubusercontent.com/keenerd/rtl-sdr-misc/master/heatmap/heatmap.py
sudo chmod +x heatmap.py


STEP-2 of 6:
Free the DVB-T Dongle which is in use by a decoder like dump1090, or dump1090-mutability, or dump1090-fa.
Code: [Select]
sudo systemctl stop dump1090
sudo systemctl stop dump1090-mutability
sudo systemctl stop dump1090-fa
sudo systemctl stop rbfeeder

STEP-3 of 6:
Once DVB-T Dongle has been made free, run following test
Code: [Select]
sudo rtl_power -f 800M:1200M:100k -i 30 -c 50% -e 30m -g 30 -F 9 >scan.csv


The above command will generate following output.

Code: [Select]
Number of frequency hops: 286
Dongle bandwidth: 2797202Hz
Downsampling by: 1x
Cropping by: 50.00%
Total FFT bins: 9152
Logged FFT bins: 4576
FFT bin size: 87412.56Hz
Buffer size: 16384 bytes (2.93ms)
Reporting every 30 seconds
Found 1 device(s):
  0:  Realtek, RTL2832U, SN: 00001003

Using device 0: Generic RTL2832U
Detached kernel driver
Found Rafael Micro R820T tuner
Tuner gain set to 29.70 dB.
Exact sample rate is: 2797202.148434 Hz
[R82XX] PLL not locked!


Wait for 30 minutes for scan to finish.
When scan is finished, it will say "Exiting.... Canceled by user".
Scan will create a file "scan.csv" in current folder and save scan data in it.

This will produce a very wide image (4000 pixels) that shows spectrum power from 800MHz - 1.2GHz.
If you want a narrower image, increase “100k” above to something larger, it controls the bandwidth that corresponds to one pixel on the x axis.
-i controls the integration interval (time for one pixel on the y axis)
-e is the total runtime, longer gives you a taller image.


STEP-4 of 6:
Don't forget to Reboot Pi so that system is restored to normal, and data feeding is restored.
Code: [Select]
sudo reboot


STEP-5 of 6:
Create an image "scan.png" in current folder from data stored in file "scan.csv"
Code: [Select]
./heatmap.py scan.csv scan.png

This will produce a very wide image (4000 pixels!) that shows spectrum power from 800MHz - 1.2GHz.


STEP-6 of 6:
Copy the image "scan.png" from Pi to your Win/Mac Computer.  To copy a file from Pi, you will need to install on your Win/Mac computer an SCP software. Some popular free of cost software are FileZilla (win and mac) or WinSCP (win) or CyberDuck (win and mac).


Example of Scan of Existing RF Signals by rtl-power

The original image is very wide (4000 pixel), but displayed in this forum smaller (1280 pixel). As a result details are not clear.


Three 500 pixel wide cut-outs from above 4000 pixel wide image. These cutouts show details better.


« Last Edit: May 12, 2018, 05:04:54 PM by abcd567 »

abcd567

  • Hero Member
  • *****
  • Posts: 842
  • CYYZ - Toronto
Re: Do I Need A Filter?
« Reply #2 on: November 08, 2017, 02:05:48 AM »
OPTION-2:
DVB-T plugged into Windows Computer - Using GUI rtlpan.exe

Important: If you want to plug in your DVB-T Dongle into Windows Computer, you should install its driver Zadig.

STEP 1 of 7:
Create a new folder of a name of your choice and at a location of your choice. For this guide, I will use new folder name "RF Scan", location inside "Download" Folder.

STEP 2 of 7:
Download RelWithDebInfo.zip from here:
Download Link: http://osmocom.org/attachments/download/2242/RelWithDebInfo.zip

Web Page: https://osmocom.org/projects/sdr/wiki/rtl-sdr
(scroll down to bottom of page to find download link)


STEP 3 of 7:
Un-zip RelWithDebInfo.zip. It will create a folder RelWithDebInfo and inside this folder another folder rtl-sdr-release which contains several files and 2 folders named x32 and x64 . Copy ALL files of folder x32 into newly created folder RF Scan.

STEP 4 of 7:
Download rtlplan.exe from the site given below, and save it inside the folder RF Scan
https://sourceforge.net/projects/guiforrtlpower/


STEP 5 of 7:
Double-click rtlpan.exe  to start the software.

STEP 6 of 7:
In the rtlpan window, make settings as follows (see screenshot below)
start freq: 800Mhz (800000000)
end freq: 1200Mhz (1200000000)
step: 100kHz
Gain: 49.6


STEP 7 of 7:
Press "START" Button. The scan will start and the scan image will start building gradually. Wait for about 15 to 30 minutes for scan image to build to sufficient height. Click "STOP" button to stop the scan. In addition to scan image, a file scan.csv will be generated inside folder "RF Scan"


« Last Edit: May 12, 2018, 05:08:53 PM by abcd567 »

abcd567

  • Hero Member
  • *****
  • Posts: 842
  • CYYZ - Toronto
Re: Do I Need A Filter?
« Reply #3 on: November 12, 2017, 04:06:58 AM »
OPTION-3:
DVB-T plugged into Windows Computer - Using Command Line


Important: If you want to plug in your DVB-T Dongle into Windows Computer, you should install its driver  Zadig from  http://zadig.akeo.ie/


STEP 1 of 7:
Download Python Installation File python-2.7.14.msi  from the site given below, and install it on your computer
https://www.python.org/downloads/

STEP 2 of 7:
Download Python Imaging Library Installation File Pillow-4.3.0.win32-py2.7.exe from the site given below, and install it on your computer
https://pypi.python.org/pypi/Pillow/4.3.0

IMPORTANT NOTE: Pillow and PIL are not compatible. If you have already installed PIL, first uninstall it, and then install Pillow


STEP 3 of 7:
Create a new folder of a name of your choice and at a location of your choice. For this guide, I will use new folder name "RF Scan", location inside "Download" Folder.

STEP 4 of 7:
Download RelWithDebInfo.zip from here:
Download Link: http://osmocom.org/attachments/download/2242/RelWithDebInfo.zip

Web Page: https://osmocom.org/projects/sdr/wiki/rtl-sdr
(scroll down to bottom of page to find download link)


Un-zip RelWithDebInfo.zip.
It will create a folder RelWithDebInfo and inside this folder another folder rtl-sdr-release which contains several files and 2 folders named x32 and x64.

Open folder x32


Copy following 3 files of folder x32 into newly created folder RF Scan.
(1) libusb-1.0.dll
(2) rtl_power.exe
(3) rtlsdr.dll


STEP 5 of 7:
Download file heatmap·py by Right-Clicking on the link below, and choosing "Save Link As..."
Move the downloaded file heatmap·py into folder RF Scan.

https://raw.githubusercontent.com/keenerd/rtl-sdr-misc/master/heatmap/heatmap.py


STEP 6 of 7:
Make sure no program is using DVB-T Dongle. Stop any such program to free DVB-T.

Open Command console by typing cmd in search. Once the Command Console is open, do following:

Code: [Select]
# First CD to folder RF Scan
#Once in folder RF Scan, give following command
rtl_power -f 800M:1200M:100k -i 30 -c 50% -e 30m -g 30 -F 9 > scan.csv


The above command will generate following output.


Wait for 30 minutes for scan to finish.
When scan is finished, it will say "Exiting.... Canceled by user".
Scan will create a file "scan.csv" in current folder and save scan data in it.

This will produce a very wide image (4000 pixels!) that shows spectrum power from 800MHz - 1.2GHz.

If you want a narrower image, increase “100k” above to something larger, it controls the bandwidth that corresponds to one pixel on the x axis.
 -i controls the integration interval (time for one pixel on the y axis)
 -e is the total runtime, longer gives you a taller image.


STEP-7 of 7:
Create an image "scan.png" in current folder from data stored in file "scan.csv"
Open Command console by typing cmd in search. Once the Command Console is open, do following:

Code: [Select]
# First CD to folder RF Scan
#Once in folder RF Scan, give following command
heatmap.py scan.csv scan.png

The above command will generate following output.


This will produce a very wide image (4000 pixels!) that shows spectrum power from 800MHz - 1.2GHz.


Example of Scan of Existing RF Signals by rtl-power


This image is very wide (4000 pixel), but displayed smaller. As a result details are not clear.
Click over it to see bigger size.


Three 500 pixel wide cut-outs from above 4000 pixel wide image. These cutouts show details better.


[/font]

« Last Edit: May 12, 2018, 05:12:36 PM by abcd567 »

Tom N Jerry

  • New Member
  • *
  • Posts: 2
Re: Do I Need A Filter?
« Reply #4 on: November 30, 2017, 12:17:48 AM »
This is a very useful thread. Deserves to be made Sticky by the Admin.


abcd567

  • Hero Member
  • *****
  • Posts: 842
  • CYYZ - Toronto
Re: Do I Need A Filter?
« Reply #5 on: May 12, 2018, 05:19:34 PM »
Here is RF Scan at my location showing the strong Cell / Mobile GSM signals interfering with 1090 Mhz ADS-B reception.


abcd567

  • Hero Member
  • *****
  • Posts: 842
  • CYYZ - Toronto
Re: Do I Need A Filter?
« Reply #6 on: February 20, 2019, 12:38:31 AM »
Interference from mobile / cell phone signals


The Downlink (signals transmitted by Cell/Mobile Towers) are very strong and cause problem to our ADS-B receivers at 1090 Mhz.

The Uplinks (signals transmitted by phones) are comparatively weaker  and dont cause large interference.


GSM band ƒ (MHz) Uplink (MHz)
(mobile to base)
Downlink (MHz)
(base to mobile)
Regional deployments
GSM-850 850 824.2 – 848.8 869.2 – 893.8 North America (Canada & USA)
Caribbean, Latin America
E-GSM-900 900 880.0 – 915.0 925.0 – 960.0 Europe, Asia-Pacific,
Middle East and Africa

 
« Last Edit: February 21, 2019, 06:33:11 PM by abcd567 »

saihoufung

  • New Member
  • *
  • Posts: 6
Re: Do I Need A Filter?
« Reply #7 on: March 05, 2019, 11:08:13 PM »
Hi @abcd567

Here is my screenshot of the RF Range 800-1200MHz using the radarbox flight stick only.


abcd567

  • Hero Member
  • *****
  • Posts: 842
  • CYYZ - Toronto
Re: Do I Need A Filter?
« Reply #8 on: March 06, 2019, 08:25:54 AM »
Hi @abcd567

Here is my screenshot of the RF Range 800-1200MHz using the radarbox flight stick only.

You still have strong GSM900 Mhz signal. Add a filter which can remove it.

Flightaware has recently marketed a new "1090 Mhz only" filter which they claim can filter out GSM900

https://discussions.flightaware.com/t/announcing-the-new-1090-mhz-only-bandpass-filter/45287/15

.
« Last Edit: March 06, 2019, 08:29:15 AM by abcd567 »

Runway 31

  • Moderator
  • Hero Member
  • *****
  • Posts: 33510
Re: Do I Need A Filter?
« Reply #9 on: March 06, 2019, 09:01:39 AM »
Have ordered a dark blue filter.  I already have light blue filter which is OK for North America but not so good for Europe.  There are radio masts and cell towers near where I stay in Spain so the dark blue will be great for me.  Thanks for the link

Alan
« Last Edit: March 06, 2019, 10:24:28 AM by Runway 31 »

abcd567

  • Hero Member
  • *****
  • Posts: 842
  • CYYZ - Toronto
Re: Do I Need A Filter?
« Reply #10 on: March 07, 2019, 05:24:19 PM »
Have ordered a dark blue filter.  I already have light blue filter which is OK for North America but not so good for Europe.  There are radio masts and cell towers near where I stay in Spain so the dark blue will be great for me.  Thanks for the link

Alan

User @elljay has posted a scan with & without Dark Blue Filter in FlightRadar24 forum.
Since one need to login to FR24 forum to see the attachment image there, I am attaching that image here:

- Top scan: Without any filter.
- Bottom scan: With "New 1090 MHz Only" filter (Dark Blue)
« Last Edit: March 07, 2019, 05:30:51 PM by abcd567 »

Runway 31

  • Moderator
  • Hero Member
  • *****
  • Posts: 33510
Re: Do I Need A Filter?
« Reply #11 on: March 07, 2019, 07:10:20 PM »
Received the filter today, no need for it here as I don't have any towers near and I wont get the benefit of it until I am in Spain  in June

Alan

abcd567

  • Hero Member
  • *****
  • Posts: 842
  • CYYZ - Toronto
Re: Do I Need A Filter?
« Reply #12 on: December 27, 2020, 10:28:38 AM »
OPTION-4:
DVB-T plugged into Windows Computer - Using software "Spektrum"

This is a wide-band scan, and covers the entire bandwidth of DVB-T Dongle (24 MHz to 1800 MHz)
It is also pretty fast, one scan takes about 3 to 10 minutes (time depends on speed of Windows computer).

IMPORTANT: If you want to plug in your DVB-T Dongle into Windows Computer, you should install its driver Zadig from http://zadig.akeo.ie/

(1) Download Spektrum for Windows

Direct Download Link for Current Latest release for Windows:
spektrum-win64.zip

Check Download page for Latest Release:
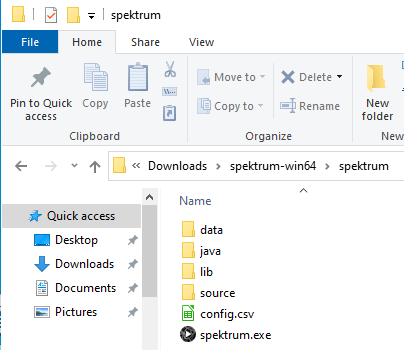
https://github.com/pavels/spektrum/releases

(2) Unzip the file, and inside you will find a file named spectrum.exe.


(3) Plug the dongle in your Windows Computer. If you have a dongle without integral filter, it will show all the signal existing in your area.

(4) Connet the antenna directly to yor dongle (No Filter)

(5) Double click the file spektrum.exe and the program will start

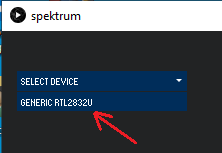
(6) When the program starts, it will detect and list the dongle as shown below. Click on the dongle name, and wait few seconds for scan to start.


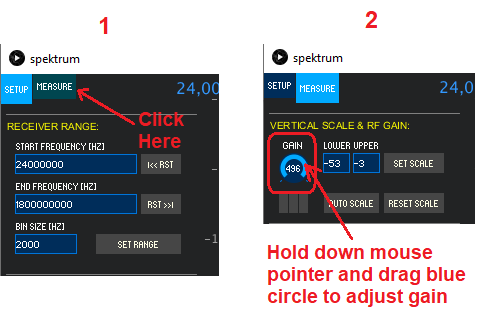
(7) Click on the “Measure” button. On “Measure” window, “Gain” will be by default 50 (it is actually 5 dB). Adjust gain by bringing mouse pointer above 50 and turning mouse’s scroll wheel. Alternatively hold mouse down on blue circle around gain value, and drag it. Set it to maximum 496 (it is actually 49.6 dB).


(8) Leave Spektrum to run for 5 minutes so that it repeats scan several times.

(9) Repeat scan with a filter inserted between Antenna and Dongle.

Here are 2 scans I have done recently:
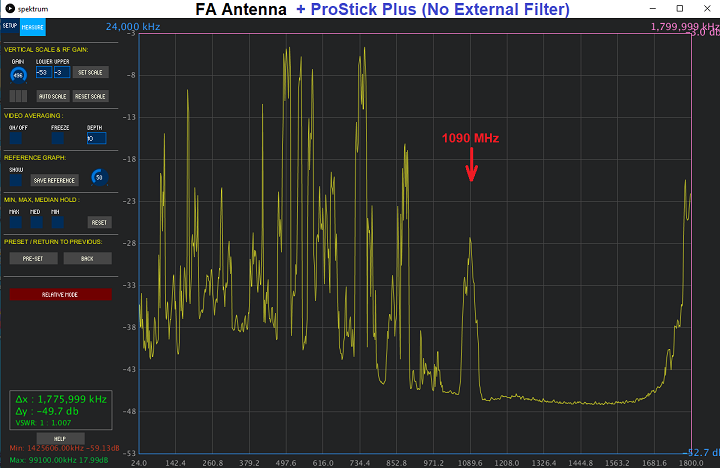
NOTE:
The scans below were done in an urban area with strong Cell/Mobile, TV, FM, Fire, Ambulance, Taxi, and other communication signals at VHF, UHF and Microwave frequencies. Other locations may not have such severe RF interference.


Scan 1 of 2 - FA Antenna + ProStick Plus (Only Internal filter of ProStick Plus. No External filter)


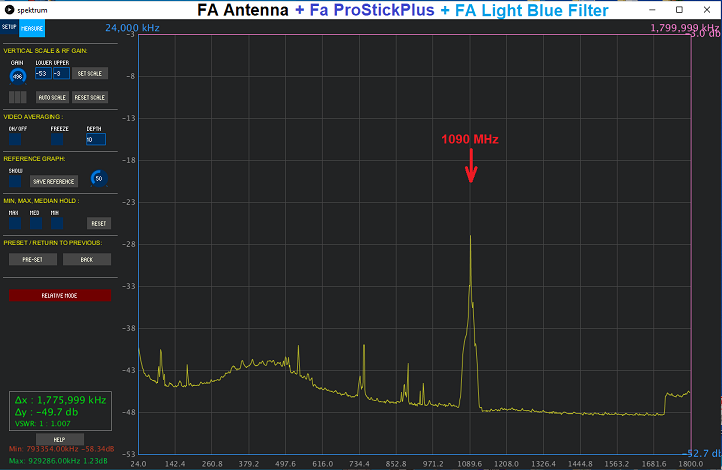
Scan 2 of 2 - FA Antenna + ProStick Plus (with internal filter) + External Filter (FA Light Blue)


.
« Last Edit: January 02, 2021, 06:34:09 AM by abcd567 »

TomNJerry

  • New Member
  • *
  • Posts: 6
Re: Do I Need A Filter?
« Reply #13 on: January 30, 2021, 07:33:16 AM »
MODERATOR:

This very useful thread, which was created 3 years ago, deserves to be made sticky.

Due to exponential growth of mobile communication, use of filter is becoming necessary, particularly in urban areas. Lot of RPi feeders will benefit from this how-to if it is made sticky.